Understanding the Anderson-Darling Normality Test
Conducting the Anderson-Darling Normality Test helps determine if a set of continuous data follows a normal distribution. The test involves comparing the sample data distribution with a standard normal distribution and evaluating the p-value to either accept or reject the null hypothesis. By collecting sufficient observations and running the test at a specified alpha level, researchers can assess the normality of their data and make informed decisions based on the test results.

Download Presentation

Please find below an Image/Link to download the presentation.
The content on the website is provided AS IS for your information and personal use only. It may not be sold, licensed, or shared on other websites without obtaining consent from the author. Download presentation by click this link. If you encounter any issues during the download, it is possible that the publisher has removed the file from their server.
E N D
Presentation Transcript
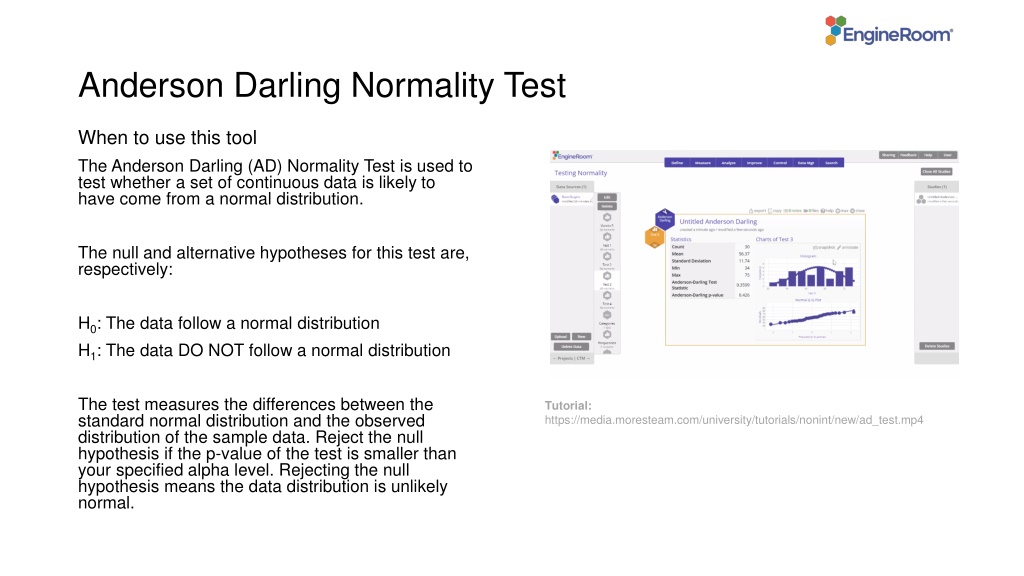
Anderson Darling Normality Test When to use this tool The Anderson Darling (AD) Normality Test is used to test whether a set of continuous data is likely to have come from a normal distribution. The null and alternative hypotheses for this test are, respectively: H0: The data follow a normal distribution H1: The data DO NOT follow a normal distribution The test measures the differences between the standard normal distribution and the observed distribution of the sample data. Reject the null hypothesis if the p-value of the test is smaller than your specified alpha level. Rejecting the null hypothesis means the data distribution is unlikely normal. Tutorial: https://media.moresteam.com/university/tutorials/nonint/new/ad_test.mp4 Tutorial: https://media.moresteam.com/university/tutorials/nonint/new/ad_test.mp4
Using EngineRoom Data Mgt > Anderson Darling
Using EngineRoom To use the AD Normality Test, collect at least 30 observations or subgroups. The data set provided contains two columns of data (Sample 1 and Sample 2) of size 30 each. Here, we run the test on each sample at the 5% alpha level.
Anderson Darling Example ADnormality_test_data.xlsx ADnormality_test_data.xlsx Click on the data file in the data sources panel and drag Sample 1 onto the Data Variable drop zone. The AD Normality Test fails to reject the null hypothesis (p-value = 0.3274 > 0.05).
Anderson Darling Example Drag off the Sample 1 variable (or close the study and open a new one) Drag on the Sample 2 variable. This time the test rejects H0 (p-value = 0.0022 < 0.05).