Comparing Proportional Relationships for Real-World Problem Solving
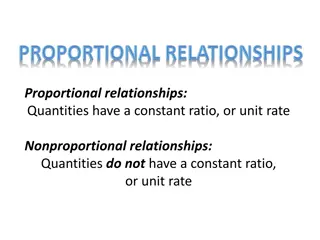
This lesson focuses on comparing proportional relationships in various forms to solve real-world problems. Students will explore unit rates, functions, and identifying slopes to analyze and compare rates of change using tables, graphs, and equations. The content covers essential questions, warm-up activities, problem-solving scenarios, and a review of unit rates through practical examples and visual aids.

Download Presentation

Please find below an Image/Link to download the presentation.
The content on the website is provided AS IS for your information and personal use only. It may not be sold, licensed, or shared on other websites without obtaining consent from the author. Download presentation by click this link. If you encounter any issues during the download, it is possible that the publisher has removed the file from their server.
E N D
Presentation Transcript
Lesson Comparing Proportional Relationships
[OBJECTIVE] The student will compare proportional relationships in different forms to solve real world problems.
[MYSKILLS] Unit Rates Functions Identifying Slope
[ESSENTIALQUESTIONS] 1. How do we identify a rate in an equation? 2. Why are unit rates so important for comparing different scenarios? 3. How do we compare rates of change using tables, graphs and equations?
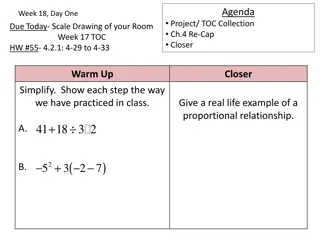
[Warm-Up] Begin by completing the warm-up for this lesson
SOLVE Problem Introduction COMPARING PROPORTIONAL RELATIONSHIPS
[LESSON] SOLVE Laura and Matt are comparing hourly pay rates. Laura s earnings are represented by the equation e = 14h, where h represents the number of hours worked and e represents her total weekly earnings. Matt s weekly earnings are shown in the graph below. Who has the higher rate of pay?
[LESSON] SOLVE y 50 Earnings ($) 40 30 20 10 1 2 3 4 5 x Hours
[LESSON] SOLVE Laura and Matt are comparing hourly pay rates. Laura s earnings are represented by the equation e = 14h, where h represents the number of hours worked and e represents her total weekly earnings. Matt s weekly earnings are shown in the graph below. Who has the higher rate of pay? S Study the Problem Underline the question. This problem is asking me to find the person who is paid at a higher rate.
Review of Unit Rates 1. Erin works weekdays and earns $500 each week. What is the unit rate for her daily income? 2. Jonathan drives 540 miles in 9 hours. What is the unit rate for his speed? 3. Betsy s candle company produces 25 vanilla candles and 5 cinnamon candles daily. What is the unit rate of vanilla candles to cinnamon candles? What are we finding for each problem? the unit rate for each scenario
Review of Unit Rates 1. Erin works weekdays and earns $500 each week. What is the unit rate for her daily income? What is a unit rate? A unit rate is a special ratio that can be found by identifying the amount of one quantity for every 1 unit of the second quantity.
Review of Unit Rates 1. Erin works weekdays and earns $500 each week. What is the unit rate for her daily income? What are the two quantities that we are comparing? money and days
Review of Unit Rates 1. Erin works weekdays and earns $500 each week. What is the unit rate for her daily income? In the context of the problem, what is the unit rate? The amount of money Erin earns in one day
Review of Unit Rates 1. Erin works weekdays and earns $500 each week. What is the unit rate for her daily income? How can we find the unit rate? Explain your answer. Divide the total amount of money earned in the week by the number of days she works.
Review of Unit Rates 1. Erin works weekdays and earns $500 each week. What is the unit rate for her daily income? How many days does she work? How do you know? She works 5 days a week. The scenario mentions that she only works weekdays.
Review of Unit Rates 1. Erin works weekdays and earns $500 each week. What is the unit rate for her daily income? What are the daily earnings? 500 5 = $100 per day
Review of Unit Rates 2. Jonathan drives 540 miles in 9 hours. What is the unit rate for his speed? What is the unit rate for Problem 2? 60 miles per hour
Review of Unit Rates 2. Jonathan drives 540 miles in 9 hours. What is the unit rate for his speed? How do you arrive at that solution? Divide the total number of miles by the number of hours to find the number of miles in 1 hour.
Review of Unit Rates 3. Betsy s candle company produces 25 vanilla candles and 5 cinnamon candles daily. What is the unit rate of vanilla candles to cinnamon candles? What is the unit rate for Problem 3? 5 vanilla to every 1 cinnamon
Review of Unit Rates 3. Betsy s candle company produces 25 vanilla candles and 5 cinnamon candles daily. What is the unit rate of vanilla candles to cinnamon candles? How did you arrive at that solution? Divide the number of vanilla candles by the number of cinnamon candles to find how many vanilla candles are made for every 1 cinnamon candle.
REPRESENTATIONS OF PROPORTIONAL RELATIONSHIPS
Representations of Proportional Relationships Verbal Description Henry makes 10 pies in 5 hours. What information are we given in this box? Henry makes 10 pies in 5 hours.
Representations of Proportional Relationships Verbal Description Henry makes 10 pies in 5 hours. In the context of the problem, what unit rate are we trying to find? the number of pies Henry makes in 1 hour
Representations of Proportional Relationships Verbal Description Henry makes 10 pies in 5 hours. ?? ???? ? ????? How do we find the unit rate? Justify your answer. Divide the number of pies by the number of hours spent baking.
Representations of Proportional Relationships Verbal Description Henry makes 10 pies in 5 hours. ?? ???? ? ?????=? ???? ? ???? What is the unit rate? 2 pies per one hour
Representations of Proportional Relationships Table 1 2 3 4 5 What are the two quantities we will use to create our table? the hours spent baking and the number of pies
Representations of Proportional Relationships Table Hours Number of Pies 2 4 6 8 10 1 2 3 4 5 What information can we add to our table from the unit rate we found in the Verbal Description box? 2 pies in 1 hour
Representations of Proportional Relationships Graph y How could we show the proportional relationship from Henry s pie baking in the form of a graph? Explain your thinking. 10 Number of Pies 8 6 4 2 We could plot points that we created in the table. 1 2 3 4 5 x Hours Baking
Representations of Proportional Relationships Table Hours Number of Pies 2 4 6 8 10 1 2 3 4 5 When you look at the values in the table, what do you predict that the graph will look like? The graph will be rising at a steady rate.
Representations of Proportional Relationships Graph y How could we show the proportional relationship from Henry s pie baking in the form of a graph? Explain your thinking. 10 Number of Pies 8 6 4 2 We could plot points that we created in the table. 1 2 3 4 5 x Hours Baking
Representations of Proportional Relationships Graph y What do you notice? 10 Number of Pies For every hour that passes, the number of pies increases by 2, which creates a straight line that rises from left to right. 8 6 4 2 1 2 3 4 5 x Hours Baking
Representations of Proportional Relationships Graph y 10 Number of Pies How would you describe the rate of change for this line? 8 6 The rate of change is constant. 4 2 1 2 3 4 5 x Hours Baking
Representations of Proportional Relationships Equation What is one of the quantities that we are working with? the number of hours spent baking
Representations of Proportional Relationships Equation h = number of hours spent baking If we had to identify a variable to represent an unknown number of hours, what could we use? h
Representations of Proportional Relationships Equation h = number of hours spent baking What is the other quantity that we are working with? the total number of pies
Representations of Proportional Relationships Equation h = number of hours spent baking p = total number of pies If we had to come up with a variable to represent an unknown total number of pies, what could we use? p
Representations of Proportional Relationships Equation h = number of hours spent baking p = total number of pies How can we connect these two variables to create an equation? We can use the rate.
Representations of Proportional Relationships Equation h = number of hours spent baking p = total number of pies Where do we include the rate when writing the equation? The rate is the pies per 1 hour, therefore, we would multiply it by the number of hours.
Representations of Proportional Relationships Equation h = number of hours spent baking p = total number of pies p = 2h Write the equation that represents the proportional relationship. p = 2h
Representations of Proportional Relationships What does each one of these representations tell us? Each one is a model of the rate of change for the situation. What conclusion can we draw from this chart? Justify your answer. Given any format of a scenario, whether it s a table, verbal description, equation or graph, we should be able to translate between the different forms.
Representations of Proportional Relationships Table Number of Cars Total Parking Fees ($) 5 2 5 8 25 How is this situation different from the previous problem? For this problem we are given a few values in the table and we must find the rate to complete the other boxes.
Representations of Proportional Relationships Table Number of Cars Total Parking Fees ($) 5 2 5 8 25 What two quantities are we comparing? number of cars and the total parking fees
Representations of Proportional Relationships Verbal Description The parking facility earns _____________. What can we conclude that we are trying to find? The amount of money a parking facility earns for each car that parks
Representations of Proportional Relationships Table Number of Cars Total Parking Fees ($) 5 2 5 8 25 What values are we going to have to use to find the unit rate? We have to use 5 and 25.
Representations of Proportional Relationships Table Number of Cars Total Parking Fees ($) 5 2 5 8 25 How can we find the unit rate from these numbers? Explain your thinking. Divide 25 by 5.
Representations of Proportional Relationships Verbal Description The parking facility earns _____________. $5 per car $? ? ??? What is the unit rate? $5 for every car that parks.
Representations of Proportional Relationships Table Number of Cars 1 Total Parking Fees ($) 5 2 5 8 25 How can we complete the rest of the table using the unit rate? We multiply the number of cars by the rate of $5 per car.
Representations of Proportional Relationships Table Number of Cars 1 Total Parking Fees ($) 5 10 2 5 8 25 What is the parking fee for 2 cars? $10
Representations of Proportional Relationships Table Number of Cars 1 Total Parking Fees ($) 5 10 2 5 8 25 40 What is the parking fee for 8 cars? $40