Understanding Shifts in Supply and Demand

Explore how changes in non-price factors can lead to shifts in supply and demand curves. Examples illustrate the impact of events like droughts and consumer preferences on equilibrium price and quantity in markets such as salmon. Graphical analyses demonstrate the effects of shifts on price and quantity changes, emphasizing the interplay between demand and supply. Gain insights into how these shifts affect market dynamics and equilibrium outcomes.

Download Presentation

Please find below an Image/Link to download the presentation.
The content on the website is provided AS IS for your information and personal use only. It may not be sold, licensed, or shared on other websites without obtaining consent from the author. Download presentation by click this link. If you encounter any issues during the download, it is possible that the publisher has removed the file from their server.
E N D
Presentation Transcript
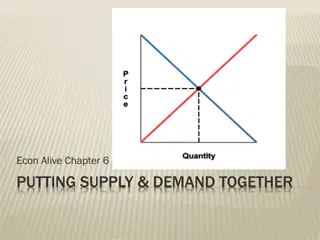
3A Changes in Both Demand and Supply
Shifts in Supply and Demand The supply and the demand curves can shift based on changes in non-price factors. Supply shifts Generally caused by factors that change production costs Demand shifts Generally caused by factors that change our willingness to pay for goods
Shifts in Supply and Demand: Example 1 Consider the market for salmon, and suppose two things happen simultaneously: 1. A major drought hits the northwest United States 2. A medical journal reports that people who consume salmon live longer than people who eat other fish These two events will respectively lead to: 1. A decrease in the supply of salmon 2. An increase in the demand for salmon
Shifts in Supply and Demand: Example 2 By itself, the decrease in supply leads to: Higher equilibrium price Lower equilibrium quantity By itself, the increase in demand leads to: Higher equilibrium price Higher equilibrium quantity Combined effects? Higher equilibrium price Equilibrium quantity???
Graphs of Shifts1 Impact on price and quantity Change Illustration The demand and supply curves shift to the right. The shifts reinforce each other with respect to quantity, but act as countervailing forces along the price axis. Demand and supply both increase The demand and supply curves shift to the left. The shifts reinforce each other with respect to quantity, but act as countervailing forces along the price axis. Demand and supply both decrease
Graphs of Shifts2 Impact on price and quantity Change Illustration The demand curve shifts to the right and the supply curve shifts to the left. The shifts reinforce each other with respect to price, but act as countervailing forces along the quantity axis. Demand increases and supply decreases The demand curve shifts to the left and the supply curve shifts to the right. The shifts reinforce each other with respect to price, but act as countervailing forces along the quantity axis. Demand decreases and supply increases
Practice What You Know Consider the market for bananas. Suppose that both the supply of and demand for bananas increases simultaneously. Which of these effects is certain? A. The equilibrium price of bananas will increase. B. The equilibrium price of bananas will decrease. C. The equilibrium quantity of bananas will increase. D. The equilibrium quantity of bananas will decrease.